Fusion SMB instead of Samba: Why?
Heya folks, it’s Ned Pyle again. Let’s talk about how Tuxera Fusion SMB stacks up to its Linux community alternative, Samba....
We are here to help
Have a question or need guidance? Whether you’re searching for resources or want to connect with an expert, we’ve got you covered. Use the search bar on the right to find what you need.

Fusion SMB allowed MLPerf to read training data 10x faster than Samba and keep 24 GPUs fed, trouncing the competition. Read on for a quick tour of the benchmark results, before diving into the full report.
The differences in benchmark numbers for Fusion SMB and the competition are not subtle. On a single test server, speeds over ten times faster than Samba can be measured and the number of accelerators that can be sustained is double that of the next-best alternative. For follow-up, the complete results, methodology, and architectural reasoning can be found in The Fusion SMB performance and evaluation primer.
Download the Tuxera Fusion SMB Benchmark ReportFor years, the transport protocol was a secondary consideration. The network was the main constraint, followed by the storage system. The file server, as essential as it is, was almost an afterthought.
With 200Gb and 400Gb network adapters now available in mainstream servers (and with 800Gb on the way), and with fast solid state memory-based storage systems capable of saturating them, the slowest piece is suddenly the file server itself. A protocol implementation that cannot distribute work evenly across multiple CPU cores, cannot make use of hardware offloading features such as Remote Direct Memory Read (RDMA), or one that does not cluster effectively across multiple nodes will cap your throughput long before your hardware does.
This is the gap that our benchmarks reveal. It is not a question of network versus storage bandwidth, but the differences in the various file sharing implementations pitted against each other on an otherwise even playing field.
The clearest single point of comparison is sequential read throughput against Samba, the open-source starting point for most Linux deployments.
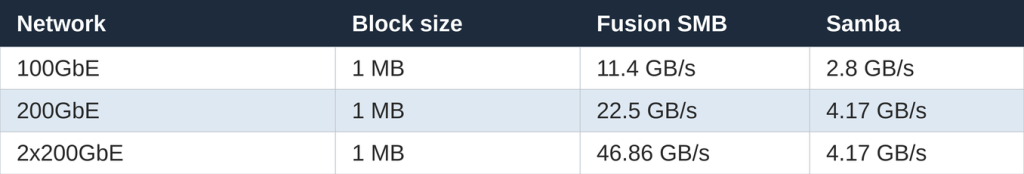
As the network and storage get faster, Fusion SMB scales toward the storage ceiling while Samba falls further behind. Fusion SMB uses a multithreaded, user-mode design with a mature multichannel implementation and full RDMA support, enabling SMB Direct. The use of RDMA on capable hardware allows for bypassing much of the networking stack, leaving more CPU capacity available for other tasks. As a result, adding a second 200Gb path roughly doubles throughput with Fusion SMB.
Samba by comparison uses a process-per-connection model and does not support RDMA. The results show that increasing the available bandwidth or storage performance does almost nothing for Samba’s numbers, as the architectural limitations prevent it from turning the extra bandwidth into client-visible throughput. The report explains this in depth. For a more complete side-by-side feature compare, the Fusion SMB instead of Samba blog post will have you covered.
If your reference point is Windows Server rather than Samba, the report covers that comparison too. The largest gains in favor of Fusion there can be seen in random writes and small-block I/O. A more complete version of that comparison is in the Fusion SMB instead of Windows Server blog post.
Peak throughput is one thing, but keeping GPUs busy poses an additional challenge. The MLPerf 3D-UNet benchmark simulates a real AI training workload and measures how many accelerator units a storage server can satisfy above at the required 90 percent utilization threshold. This requires sustained high-performance, as momentary dips in transfer rates can cause breaks or bubbles in the execution of the accelerators. In this benchmark, more passing units equate to more GPUs enjoying a sufficient and reliable flow of data from the server.
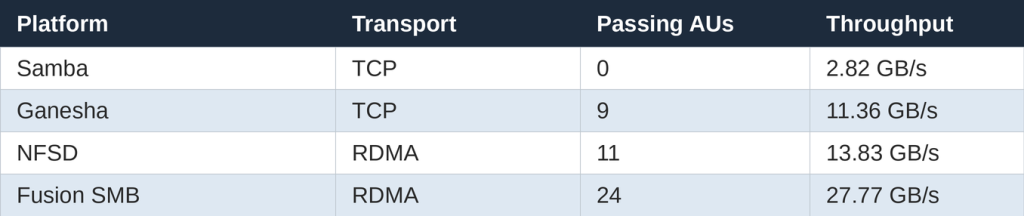
A single Fusion SMB server feeds roughly twice as many GPUs as the same host running other file server implementations such as NFSD or Ganesha. Samba does not register a single passing accelerator with this workload, which makes it unfeasible for AI training at scale.
SMB 3, along with RDMA, multichannel, and scale-out, allows for the fast movement of very large amounts of data. On training workloads, that is what wins. For why the storage layer rather than GPU compute is the typical bottleneck in production AI, see the AI bottleneck blog post.
Checkpoints are bursty, large, and frequent. A training run saves its state at regular intervals, so it can resume after a failure, and if storage cannot absorb those writes quickly, the checkpoint becomes the longest-running operation in the run.
During a trial of 104.7 GB LLaMA3-8B checkpoint, Fusion SMB completed the save in 6.7 seconds. Samba took 28.1 seconds. NFSD and Ganesha landed at 7.9 and 10.4 seconds respectively. Across hundreds of checkpoints in a multi-day run, the difference between 7- and 28 seconds compounds into hours of GPU time spent waiting on storage rather than training.
Performance numbers on a test system are of course exciting, but the cost of running a production environment is a more real and tangible point of interest. In a real IBM Storage Scale deployment serving 150 GB/s of aggregate throughput, Fusion SMB was used to replace the existing Samba protocol layer at a much smaller footprint.
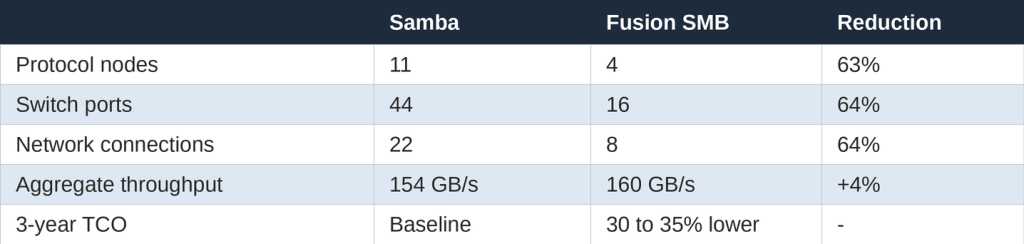
Fewer nodes naturally mean fewer licenses, less power, less cooling, fewer cabling, and in general a lower overhead to operate. Fusion’s performance characteristics still allow for aggregate throughput to go up rather than down.
This is the high-level view. The full Fusion SMB performance and evaluation primer dives deeper:
Every figure here came from a controlled test environment. Yours will look different, because your network, your storage, and your workloads are different. That is the point of an evaluation: to find out which of these gaps show up most clearly on your stack.
You may want to check out the full benchmark report if you’re interested, and then talk to our team about running the appropriate tests on your hardware.
Download the Tuxera Fusion SMB Benchmark Report Ready to talk to a Fusion engineer? Get in contactRELATED ARTICLES

Heya folks, it’s Ned Pyle again. Let’s talk about how Tuxera Fusion SMB stacks up to its Linux community alternative, Samba....

Heya folks, it’s Ned Pyle again. Last year I talked about how Fusion SMB stacks up to Samba in enterprise workloads. If you run or integrate cloud, machine learning, media & entertainment, or HPC services, Fusion SMB is the right choice for Linux file servers. But...
Mission-critical file sharing for media deployed on-prem, containerized or in the cloud. Tuxera, a leading provider of quality-assured file systems...
When AI platforms underperform in production, most teams reach for more GPUs. But the real bottleneck is often the storage...
Suggested content for: